
Remote Sensing Helps Describe the Relationship Between Oak Mortality and Forest Structure Through Time
Oaks ‘n’ Folks – Volume 20, Issue 1 – January 2004
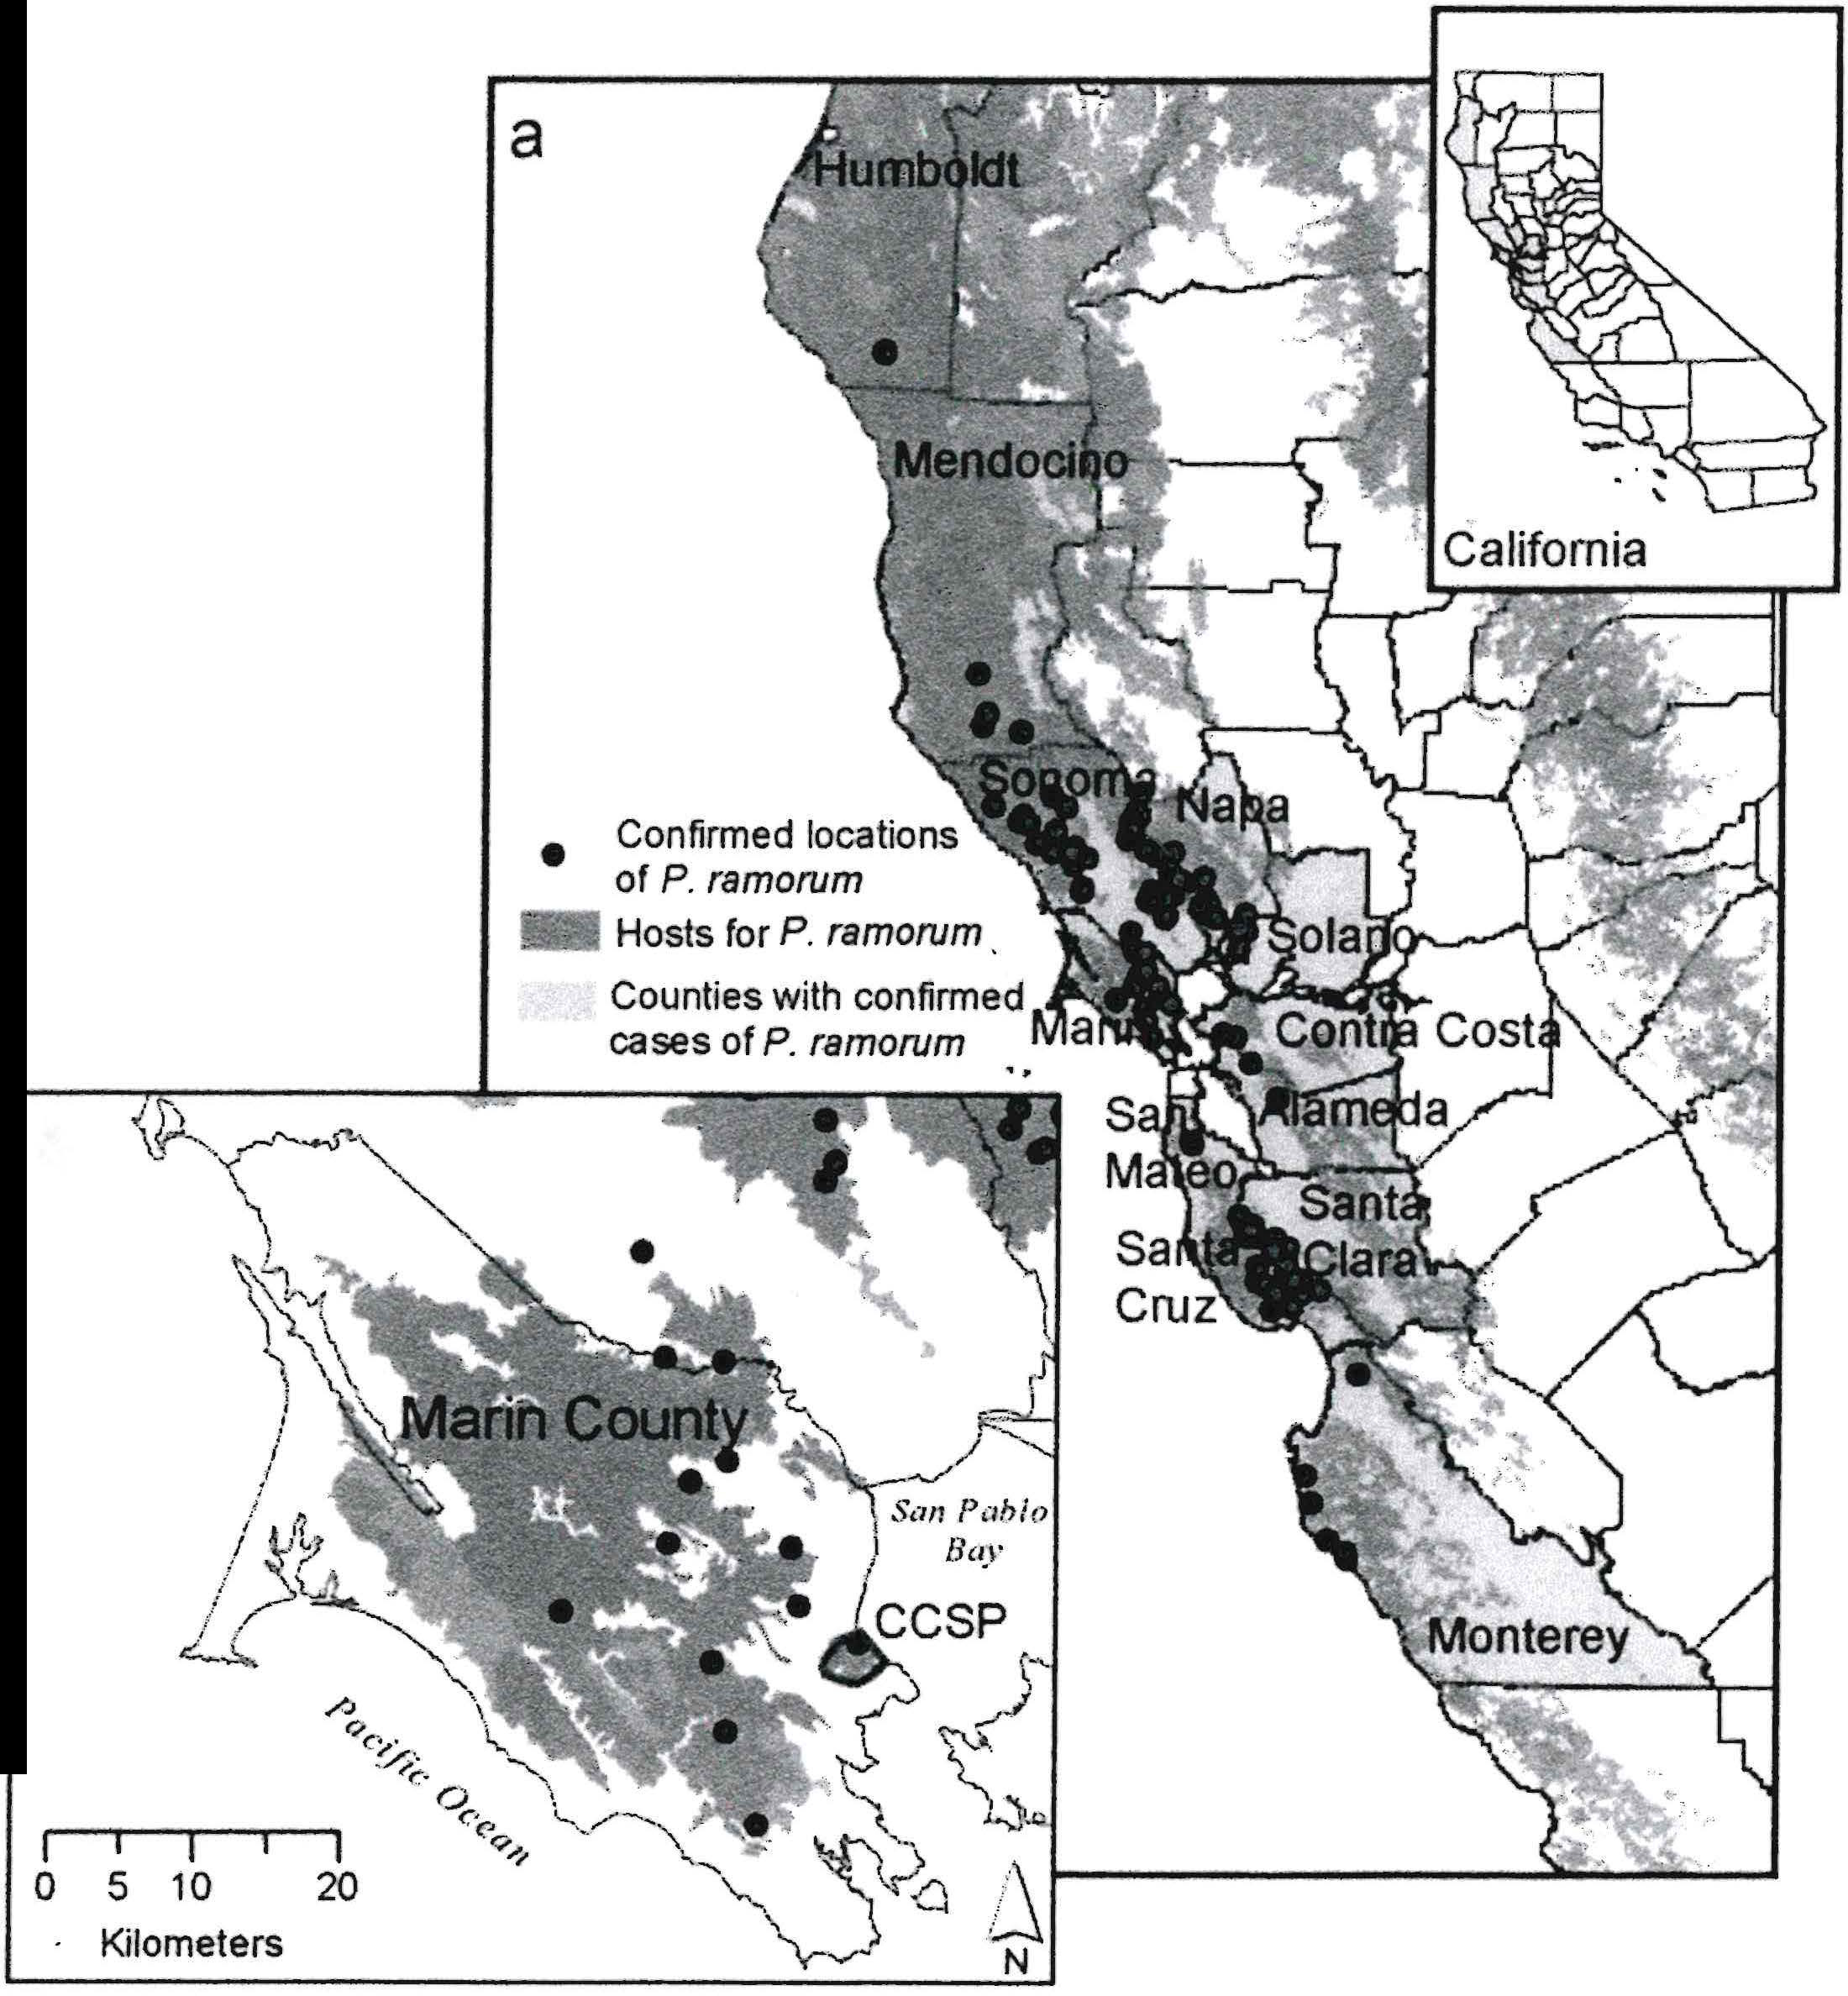
Sudden Oak Death has been a concern for many Californians, as it continues to affect many of our beloved central coastal forests. The disease is caused by a newly discovered pathogen called Phytophthora ramorum, which has killed hundreds of thousands of trees, including tanoak (Lithocarpus densiflorus), coast live oak (Quercus agrifolia), and black oak (Q. kelloggii) (Rizzo and Garbelotto, 2003). As of August 2003, the disease existed in 12 coastal counties in California and one county in Oregon (see Figure 1, and for more information, go to www.suddenoakdeath.org).
|
|
Some research has shown that the distribution of Sudden Oak Death seems to be influenced by such factors as proximity to California bay trees (Umbellularia californica) and forest edges (Kelly and Meentemeyer, 2002; Swiecki and Bernhardt, 2002), and research on the relationship between the disease presence and forest structure continues. The linkages between forest density and rate of mortality in an affected system are critical to understanding the mechanisms underlying the dispersal of pathogens. Since the disease causes very visible crown dieback in the affected Quercus species, remote sensing (change detection using aerial or satellite imagery) has been useful in monitoring the disease. In this study, I used remote sensing analysis to answer the following questions: 1) Is mortality increasing in the study area China Camp State Park? 2) What are background mortality rates in this forest? 3) Does forest structure play a role in mediating disease-related mortality?
High-resolution remote sensing (about 1 meter spatial resolution) is useful for mapping individual trees, and for mapping mortality in forests. The near infrared reflectance is particularly useful for mapping vegetation and stressors on vegetation. Using remote sensing allows us to monitor a wider area than can be covered by foot, and the spatial patterns in mortality revealed by the broad view afforded by remote sensing might not be seen from the ground.
I used Airborne Digital Acquisition and Registration (ADAR) imagery with 1-meter spatial resolution and four “bands” (blue light, green light, red light, and near infrared reflectance) to map dead and dying trees in a study area in Marin County, CA in the spring of 2000, 2001, and 2002, resulting in a picture of mortality spread through time. I also used historic aerial photography from 1985 to discern levels of background oak mortality at a time before the disease was present. I then looked at rates of mortality in three different levels of forest density (<50% crown closure, 50-80% crown closure, and >80% crown closure).
This research is focused in China Camp State Park (CCSP) in Marin County. CCSP is a wooded peninsula (1,000+ ha) bordering on San Pablo Bay in the San Francisco Bay area. It has moderate to steep topography, with elevations ranging from sea level at San Francisco Bay to over 300 m. The forest consists of near even-age stands, as these hillsides were cleared for lumber in the early to mid-1800s. Coast live, black, and valley oaks (Q. lobata) are abundant, and occur in mixed stands with mature madrone (Arbutus menziesii) and bay trees that provide habitat for a variety of wildlife, including deer, squirrels, and numerous birds. All of these trees, with the exception of valley oaks, are hosts for P. ramorum and it is commonly agreed that CCSP is experiencing epidemic levels of mortality.
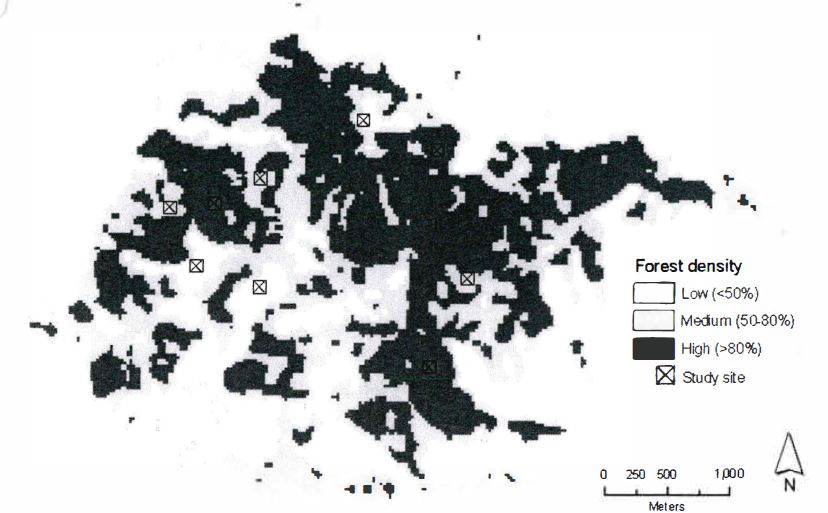
ADAR imagery was acquired for CCSP on March 30, 2000, May 5, 2001, and May 28, 2002. Scanned 3-m spatial resolution color infrared imagery from late spring 1985 was acquired from a colleague. I first determined the forest density over the study area by using a standard vegetation enhancement technique called normalized difference vegetation index (NDVI). The earlier imagery was used for this purpose since there was no SOD disease present at that time. I used the earlier imagery to determine the amount of forest in a 1-ha (100m x 100m) neighborhood across the image, and then classified the resulting image into high, medium, and low forest density using the following metrics: low = <50% crown closure, medium = 50-80% crown closure, and high = >80% crown closure. Within these areas I randomly located the center of three sites within each forest density class; these are shown in Figure 2.
|
|
I then determined the number of dead trees within each study area from the more recent imagery. Using image classification routines, I calculated forest cover and tree density within each study area. Since I was interested in determining the effect of time on level of mortality, as well as the influence of forest density on mortality, I examined the difference in mortality statistics across forest density and date both visually and statistically (single factor analysis of variance (ANOVA) of all values across date and density, and in a pairwise fashion between each year, and each density class).
Mortality through time
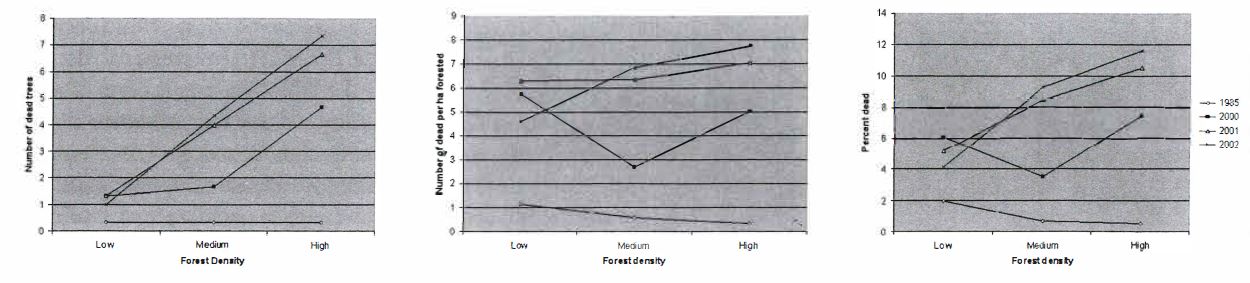
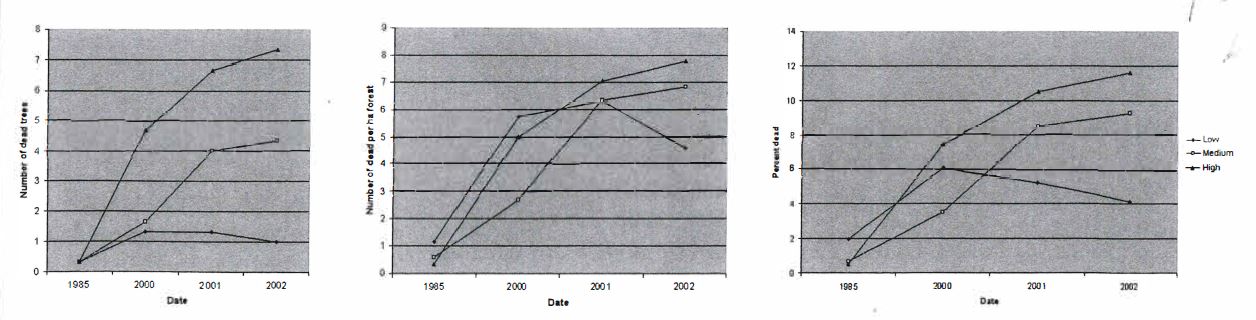
I found that there were clear trends in overall mortality across dates, although there were differences between plots. Mortality increased from 1985 through 2002, ranging from approximately one dead tree per ha, or two percent of trees dead, in 1985 to a high of approximately 11 dead trees per ha, or approximately eight percent of trees dead, in 2002 (Figure 3b & c). Interestingly, plots in low and medium density plots showed increases through all years, but in high density plots this was not the case. The differences between dates were significant between 1985 and 2000 for number of dead, number of dead by ha, and percent dead. However, increases in mortality in recent years (2000-2002) were not significantly different from each other. These results suggest that while the SOD epidemic is indeed dramatic in CCSP in recent years, producing mortality well above background levels, it is not currently increasing significantly.
|
|
Mortality by forest density
Density did not play a role in controlling spread of the disease. While the number of dead trees seemed to have density-related controls (e.g., there are more dead trees in high density plots than in low density plots) this is to be expected, as higher density results in a larger number of trees to be infected (Figure 4a). The normalized values of dead trees per ha and percent mortality present a less convincing argument (Figures 4b & c). There is a difference in mortality between low and medium density plots, but not across all densities nor between low and high or medium and high density plots. There are no significant relationships in percent mortality among any of the density classes.
|
|
It should be noted here that the estimation of percent of trees dead most likely underestimates the actual percent mortality of host trees, as this metric is based on absolute number of crowns, not oak crowns. Rizzo and Garbelotto (2003) reported mortality rates of 4 – 35 percent in this woodland type.
In conclusion, mortality has increased from background levels experienced before the SOD epidemic, but in recent years the disease seems to have been slowing in the park. Background mortality rates were below two percent, or around one tree per ha dead. There does not seem to be a relationship between mortality and forest density, with all density classes experiencing mortality across all years.
References
Kelly, M. and Meentemeyer, R.K., 2002. Landscape dynamics of the spread of Sudden Oak Death. Photogrammetric Engineering & Remote Sensing 68(10): 1001-1009.
Rizzo, D.M. and Garbelotto, M., 2003. Sudden oak death: endangering California and Oregon forest ecosystems. Frontiers in Ecology and the Environment 1(5): 197–204.
Swiecki, T. and Bernhardt, E., 2002. Evaluation of stem water potential and other tree and stand variables as risk factors for Phytophthora ramorum canker development in coast live oak, Fifth Oak Woodland Symposium: “Oaks in California’s Changing Landscape”. USDA Forest Service, San Diego, CA.
N. Maggi Kelly, Environmental Science, Policy and Management, UC Berkeley